The Tasks Dashboard is designed to provide an overview of the tasks. This page will provide an overview of how to navigate and utilize the Tasks Dashboard.
Table of Contents
- Configure View
- Filters
- Actions
- Navigating Results
- CSV Export Results
- Page Share
- Dashboard Table Overview
- Sorting the Table
- Status
Navigating to the Tasks Dashboard
Tasks vary across deliverables and these configurations are subject to change. To help the departments monitor and manage their workload, the task dashboard lists tasks in an order that allow the applicable departments to ensure efficient workflow.
There are two ways to access the Tasks dashboard:
Users may click “Tasks” under Orders in the PDX menu.
Alternatively, users may switch to the “Tasks” view while on the Work Dashboard (the default homepage of PDX)
From the Tasks View, users can navigate to the Mastering Tasks section and expand the corresponding menu. Each task within this section is organized into subcategories, which are grouped according to their Mime types.
When a user selects any task under Mastering, the system displays a list of subcategories organized by Mime type. Each subcategory includes a linked number that represents the count of tasks within that group.
Clicking on a linked number navigates the user directly to the Tasks Dashboard, where the view is automatically filtered to display only the specific subtasks contained within that selected Mime type category.
For example, when a user expands the Conformance task and clicks the linked number in front of Audio, the system will load the Tasks Dashboard. This dashboard view displays all outstanding tasks associated with Conformance / Audio assets corresponding to the number that was clicked.
The Task Dashboard enables users to:
- View and Update Task Status: Easily monitor and change the status of tasks.
- Assign Tasks: Allocate tasks to the appropriate team members, ensuring the right person handles the right work.
- Task Summary: Navigate to a tasks summary page to add QC notes, asset notes, or adjust the asset associated to the task/deliverable.
Configure View
Users can customize the field layout on the list view page to better suit their navigation and workflow preferences by clicking the two-columns button next to the Filters button in the upper right of the UI.
Once the user clicks the button, a new pop-up will open offering the user the ability to Configure their view. What this menu does is allow the user to configure the available fields that will be visible in the Task Dashboard Table.
Available fields are:
- Production Number
- Tv Season Number
- Tv Episode Number
- Version
- ERD
- Video Asset Definition
- Order Name
- Date Created
- Date Completed
- Live Date
- Vendor
- Vendor Id
By default, visible fields are:
- Title
- RDD
- Provider
- Platform
- Language
- No. of Orders
- Content Type
- Deliverable
- Task
- Status
- File Name
- Assignee
- Reject
- Order Item Name
- Order Number
This view can be customized at will, but among these fields, “Title” cannot be removed and will be greyed out.
Add or Remove Fields
To add or remove fields to the user's view, they must select the option in either box (Available Fields on the left, or Visible Fields on the right) and then click the left pointing or right pointing arrow as demonstrated below:
Sort Fields
To sort the order of visible fields, the user must drag the field of choice vertically through the list, as demonstrated below:
Restore Defaults
If, for some reason, the user wants to restore the default selection of available fields, the user may click “Restore Defaults” in the lower left to revert the Visible Fields given back to the default list mentioned earlier.
After completing any modification to the Configure Views menu, the user should click “Apply” to finalize any changes. From there, the menu will automatically close and reload the Dashboard table according to what was applied.
Filters
Within the Tasks Dashboard, the user may filter deeper into the given Tasks by utilizing either the Filter Drawer or the Additional Filters that can be opened on the right side of the UI next to the Configure Views button.
Filter Drawer
The primary filters are located in the Filter Drawer above the Tasks Dashboard table and allow users to refine the displayed results based on specific criteria.
Users may filter tasks given based on information selected in each drop-down:
- Keyword - Filtering by Title or File Name
- Season Number - Filtering by the Season Number applied to the title the task is associated with.
- Episode Number - Filtering by the Episode Number
- Providers - Selecting from a list of providers. There is a counter within the options next to each Provider's name that indicates how many items in the list of Tasks for each provider. Users may select multiple Providers.
- Platforms - Selecting from a list of providers. Similar to Providers, providing a list of mentioned platforms and a counter to indicate how many items in the list are assigned to said platform. Users may select multiple platforms.
- Deliverables - Filter from a list of types of deliverables. Users may select multiple types of deliverables.
- Tasks - Filter for the type of Tasks. Similar to other filter options, there is a counter applied to each listed Task that indicates the number of Tasks in the given Dashboard.
- Task Status - Filter based on the Status of tasks. Users may select multiple Statuses.
- Assignee - Selecting or entering the name of the assignee. Users may select multiple Assignees.
- RDD - Selecting the range of the Revised Due Date
- Urgent - Checking the box will filter for assets tagged as Urgent.
 Additional Filters
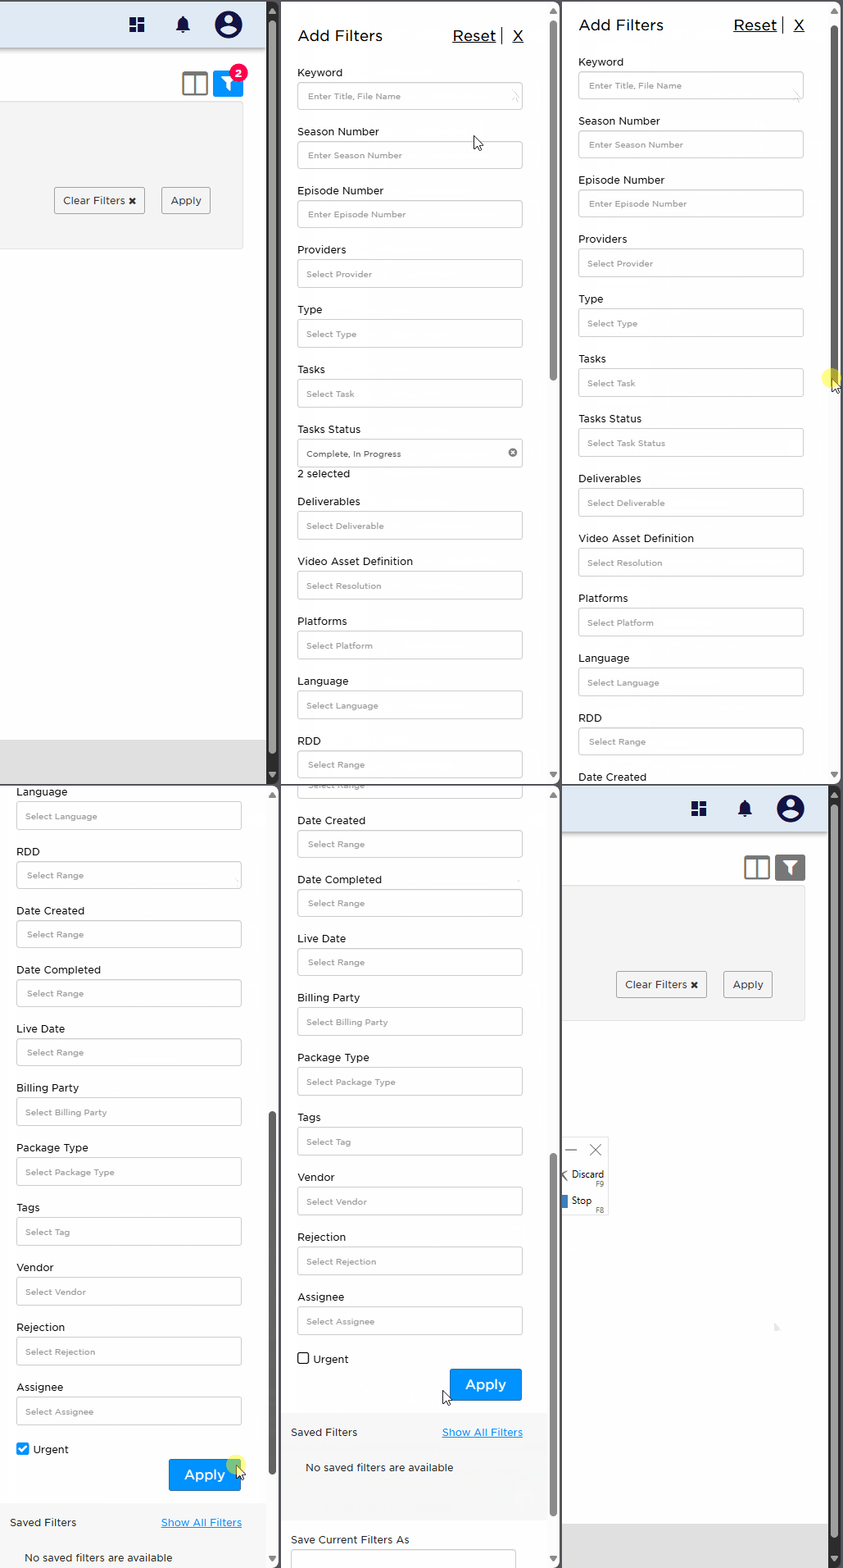
Additional filters are available in the right-side filter menu, providing users with more options to refine and customize their view. As demonstrated on the right-side:
The additional filters include:
- Video Asset Definition
- Date Created
- Date Completed
- Live Date
- Billing Party
- Package Type
- Tags - selecting from a list of keyword(s) to help search for orders easier
- Vendor
- Rejection
Actions
Located on the left-side of the page, the Action dropdown allows users to perform specific actions:
-
Add Note - Users can select one or more assets, in bulk, to add notes.
-
Download Proxy - Allows users to download the asset by restoring it to a Mastering group.
-
Replace/Ingest - This option allows users to replace the current asset with a different one.
-
Restore - This option downloads the asset from the storage server to the working server for production use.
For each option, users may select multiple tasks and apply each action in bulk.
Navigating Results
After performing a search, the Results section displays the relevant data based on your criteria. This section provides an overview of matching records and allows users to explore, filter, and act on the results efficiently.
Above the results table displays the total amount of tasks collected under that filter, the amount of pages containing a certain amount per page, and the option to select more or less results per page.
The minimum amount of pages that can be set are 10 and the maximum results per page goes up to 150. Users may select the amount of results by clicking the drop-down menu.
The page will reload with the applied amount. With more total results and fewer displayed on pages, the amount of pages will grow. Utilizing the filters will help reduce results further.
CSV Export Results
With the amount of results in mind, users are able to export a CSV report of the current list of tasks.
This can be done by clicking on the export icon on the top right of the page.
When selecting the export icon on the Task Dashboard view, users will see the below prompt.
In this pop-up window, users can choose to export the task report, either with or without rejection details.
After clicking yes, a new tab will open that will take the user to the My Jobs page, the Orders tab. The user's job should appear with an Export Type called “Tasks”, correspond to the date Requested (PST time), have the user's account name, and it's current status as “Not Started”.
If the user clicks the “Refresh” button in the upper right, the results will refresh with the current status of the Export job.
Once in progress, the Status will change to “Pending” and then finally “Complete” allowing the user to see the Download button.
Headers within the CSV export correspond to the same headers/filters located in the Tasks Dashboard
Page Share
Within the Tasks Dashboard is an option to share the current results and filter with another user. Located to the right of the CSV Export button and below the Filter Drawer is the “Share” button.
This option allows the user to copy a link that will perpetually direct anyone who has that link to the given results on the Tasks Dashboard.
Dashboard Table Overview
Sorting the Table
Brief definition of each table's header.
- “#” (Flag) - Allows the user to sort by tasks that are flagged as urgent.
- Title - The title of the content associated with the Task and Deliverable
- RDD - Sort by the revised due date
- Provider - Sort by provider
- Platform - Sort by the platform
-
Language - Sorting by language.
- For a list of supported language codes, click here.
- No. of Orders - Sort by the amount of Orders associated with the task.
- Content Type - Sort by the content type
- Deliverable - Sorting by the type of deliverable as it corresponds to the content type.
- Task - Sort by the task for the deliverable
- Status - Sort by the status of the task
- Filename - Sort by the file name.
- Assignee - Sort by whoever is assigned or unassigned.
- Order Number - Sort by the Order Number associated.
Notes
The user has the option to view notes associated with each order through by clicking the notes button.
The Notes panel provides users with visibility into all notes associated with an order, order item, or deliverable. Existing notes appear in the lower half of the pop-up window, giving users contextual insight into activity and communication history for that specific record.
Available Filters
Users can refine which notes appear by applying one or more of the following filters:
-
View: The View drop-down menu allows users to select which Note Types they wish to view. Each note type is attributed to a specific entity within PDX (e.g. Order, Order Item, Deliverable). By adjusting this filter, users can drill deeper into a specific level of detail and isolate notes for a particular item within the same title.
-
Status: This filter distinguishes whether a note is Active or Closed, helping users understand whether the note is still relevant or actionable. Active notes typically indicate open discussion points or pending tasks that require review.
-
Client Notes: Users may filter by whether a note is visible to the client.
- Show Client checked → The note is client-visible.
- Show Client unchecked → The note is internal only.
Note Fields
Each individual note includes the following data fields:
- Note Type – Identifies what the note is associated to (e.g., Order, Order Item, Deliverable, etc.).
- Timestamp – The date and time the note was added.
- User – The name of the user who created the note.
- Notes – The content of the note itself.
- Status – Indicates if the note is Active or Closed.
- Show Client – Indicates whether the note is visible to the client (checkbox).
View Field Behavior
On the Notes panel, when a user clears the “View” field or select “All Notes” from the dropdown list:
- The Notes window now displays all notes relevant to the selected Title, including:
- Deliverable-level notes
- Order Item-level notes
- Order-level notes
This means users can now see comprehensive note visibility across connected entities without needing to manually toggle between each specific Note Type. This functionality mirrors the expected behavior found in Order Item View, where clearing the “View” also populates all available notes across related entities. For more information regarding notes on Orders and Order Items, click here.
Blue Notes Icon Behavior
Users now have broader visibility into notes across different hierarchy levels within the Task View. To access these notes, users can click the Blue Notes Icon located on the Task Dashboard.
The Blue Notes Icon appears dynamically based on the presence of notes associated with related entities such as Orders, Order Items, or Deliverables. This enhancement ensures users can easily identify and access all relevant notes directly from the Task Dashboard.
Status
In the Status column, users can observe and change the status of the task associated. For more information about the different statuses for orders and order items, click here.
Users may change the status of multiple Order Item's Tasks by selecting multiple and then selecting a new status from the drop-down menu:
The status box will state that it's “Updating.” Once complete, the new status should be reflected.
Tasks that have Task Bundling enabled will make it so that the deliverable and task combo appears once. For more information on Task Bundling, click here.